Initial genome analysis
I now have one closed bacterial genome and a second genome which has 3 contigs. Getting one closed contig is satisfying, however the 3 contigs of the second genome are interesting. The first contig seems to be a closed genome at 5.3 Mb, the second contig is 13 kb and has 15 genes according to Rast 10 of which are bacteriophage genes, the other five are hypotheticals. The third contig is 20 kb, with 21 annotated genes one of which is a DNA invertase. There is also a dispairty in GC content between the whole genome contig (53%) and the two small contigs (48% and 47%). In terms of my future work the addition of mobile gene elements is incredibly relevant, I have no idea whether this putative bacteriophage is transient or has become a fixture in this particular strain and what kind of impact it may have on oak tree pathogenesis.
HGAP2 vs HGAP3
There were some disparities in results between HGAP 2 and 3 assemblies. For my 3 contig genome the coverage was and quality of the smaller two contigs using HGAP 2 was low whereas in HGAP 3 the coverage and quality was far higher. One of the contigs had such low coverage and confidence that it should be discarded according to the pacbio genome finishing guidelines. The three contigs in HGAP2 and 3 are identical in both sequence and consequently annotated function. Resequencing of the HGAP2 assembly using the RS_Resequencing.1 tool produces the same result as HGAP3 in terms of coverage and quality.
HGAP2 (top) has lower coverage and confidence for two small contigs than HGAP3 (bottom)
Quality Control
For QC I followed the pacbio genome finishing instructions detailed here: https://github.com/PacificBiosciences/Bioinformatics-Training/wiki/Finishing-Bacterial-Genomes.
Following the instructions I checked the deg and singleton fasta files for signs of misassembly. The deg files were empty, I had a few sequences in the singleton files (<1000 bp) which were homologous with transmembrane proteins mostly. I think the singletons are leftover reads which are not strongly aligned with the rest of the genome but I’m not entirely sure about this. I was primarily checking for plasmid genes in these files which may have been present in high copy number and indicative of a misassembly. The concordance level for both my assemblies were well above 99% so I’m confident in the accuracy of the assemblies.
There were some drops in coverage indicated by spikes in the coverage plot and may have been fused contigs or plasmids. However the coverage in these areas was still 150x so it was still relatively high. Additionally, there was no sign of any plasmid genes from my Rast annotations. There were no large increases in coverage which would be indicative of collapsed repeats or high copy number plasmids.
To check for fused contigs and legitimacy of the smaller contigs (i.e. to check they did not integrate into the genome) I used the RS_Resequencing module. This step produce the same 3 contigs as the HGAP assembly with 100% consensus concordance. Therefore with this result and abscence of plasmid genes I am confident that there is one closed genome and two extrachromosomal elements.
Motif and Modification analysis
I planned to write this blog post much earlier but had the same problem again of jobs being submitted running for hours and then crashing. This happened when trying to run the RS_Modification_and_Motif_Analysis.1 tool. I thought I had more than enough RAM and CPU’s to carry me through this process after moving to a larger instance on AWS. However it may have been due to the huge amount of data produced by 6 SMRT cells that the instance was not enough and I increased again to a c3.8xlarge instance.
The idea behind my splashing out on pacbio assemblies was to assemble two genomes to a high standard in order to find putative pathogenic proteins. However now that I have that data I thought I ought to have a look at the methylome. This data would be very useful for a fine-scale comparative genomics study but may not mean very much as a stand alone data set . I’ll try to describe some of the output files generated through this process. Again, more in depth information can be found here: https://github.com/PacificBiosciences/Bioinformatics-Training/wiki/Methylome-Analysis-Technical-Note
Output files
The methylome is the pattern of base modifications in a genome and is recorded using kinetic information during the pacbio SMRT sequencing process. Variations of the kinetic values are measured using the interpulse duration (IPD) metric. The IPD value is given in the form of a ratio where the sample of interest is compared against a control. The control can be altered, it is set as an amplified genome where the modifications are erased and can be altered to a genome of choice to provide differential modification signals. High IPD values are potential modifications. The IPD ratios for every base pair across the genome are provided in a csv and gff file. The most frequent modifications calculated across the genome are given in a csv file.
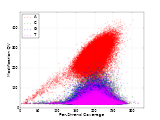
There is a nice scatterplot graphic produced revealing which bases are most frequently modified across the genome plotted against their actual frequency.
Adenine is the most frequently modified base
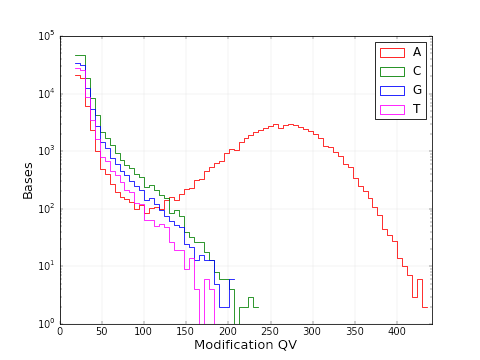
A similar histogram reveals which bases most frequently have a high modification QV and therefore are most frequently modified. The most frequent genome wide motifs are also displayed in a histogram and given in a csv file.
A similar graphic as above with adenine having a kinetic signature most divergent from that of the control
PacBio SMRTview looks a lot like Artemis. However it has the added capacity to display the kinetogram. The kinetogram is a representation of where the motifs and modifications occur on the genome.
PacBio SMRTview displays motifs and modifications
The data revealed in the methylome provides tremendous scope for epigenetic study. In terms of studying oak tree pathogens I would love to compare the methylome of pathogenic and non-pathogenic bacterial strains. That would be a few months from now as I have lots of genomic analyses to consider from the pacbio dataset. So many interesting proteins annotated, which ones to study?


